このエントリは2025/08/13現在の情報に基づいています。将来の機能追加や変更に伴い、記載事項からの乖離が発生する可能性があります。
このエントリは、以下のエントリに関連するものである。前段や背景はこちらを参照のこと。
更問をもらった。
MetricやTraceを取得できることはわかったが、Zero-code instrumentationでAzure Monitor (Application Insights)に送信することは可能なのか?
Zero-code instrumentationは以下を参照。
Zero-code
https://opentelemetry.io/docs/concepts/instrumentation/zero-code/
つまり、依存関係ならびに宛先だけ指定すれば、あとは依存関係がよろしくやってくれるのか、ということ。この確認(ならびにサンプル提供の目的もある)のため、以下のような環境を用意した。これまでの説明の通り、Logについては実行環境(IaaS、PaaSなど)で対応が異なるため、今回は対象外にする。
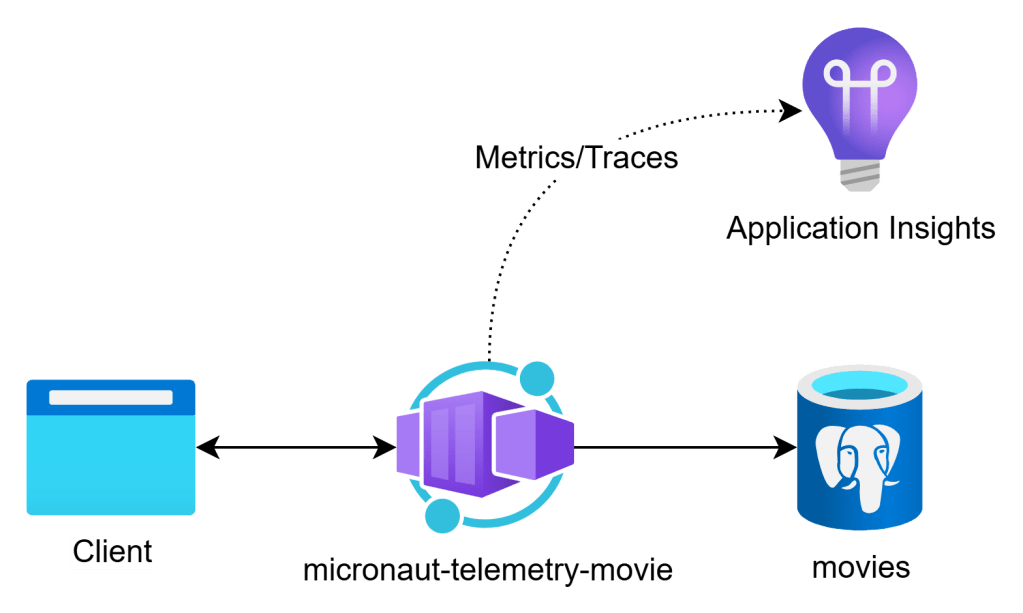
このサンプルは映画の情報を取得・追加・更新・削除できるREST APIで、データストアとしてPostgreSQLを利用し、Azure Monitor、厳密にはApplication InsightsにTraceとMetricを送信する、というもの。コードは以下にある。
micronaut-telemetry-movie
https://github.com/anishi1222/micronaut-telemetry-movie
準備するもの
利用したツールは以下。
- Maven: 3.9.10
- JDK: 21
- Micronaut: 4.9.2
Azure側では、Application Insights、PostgreSQL Flexible Serverを用意しておく。
Archetypeの生成
MicronautのCLI (mn) もしくはMicronaut Launch(Webサイト)でarchetypeを作成する。今回は(今回も)アプリケーション設定でapplication.ymlを使う。その他、データベース関連では、Micronaut Data JPAを使う。
以下はMicronautのCLI (mn) でarchetypeを作成する例。
mn create-app \
  --build=maven \
  --jdk=21 \
  --lang=java \
  --test=junit \
  --features=graalvm,management,micrometer-azure-monitor,azure-tracing,yaml,validation,postgres,jdbc-hikari,data-jpa \
dev.logicojp.micronaut.micronaut-telemetry-movie
Micronaut Launchを使う場合、【FEATURES】をクリックして、
- graalvm
- management
- micrometer-azure-monitor
- azure-tracing
- yaml
- validation
- postgres
- jdbc-hikari
- data-jpa
を選択した後、【GENERATE PROJECT】をクリックして【Download Zip】を選択すると、Zip形式でarchetypeを取得できる。
Micronaut Launch
https://micronaut.io/launch/
依存関係
Trace、Metricの送信の基本はこれまでの2個のエントリで記載した通り。
今回はHTTPとJDBC接続のtraceを取得したいので、以下の2種類の依存関係を追加しておく。
<dependency>
  <groupId>io.micronaut.tracing</groupId>
  <artifactId>micronaut-tracing-opentelemetry-http</artifactId>
  <scope>compile</scope>
</dependency>
<dependency>
  <groupId>io.micronaut.tracing</groupId>
  <artifactId>micronaut-tracing-opentelemetry-jdbc</artifactId>
  <scope>compile</scope>
</dependency>
これまで通り、GraalVM Reachability Metadata Repositoryを利用できるよう、以下の依存関係を追加する。2025/07/28現在の最新は0.11.0。
<dependency>
    <groupId>org.graalvm.buildtools</groupId>
    <artifactId>graalvm-reachability-metadata</artifactId>
    <version>0.11.0</version>
</dependency>
GraalVM maven pluginを追加し、上記依存関係で取得したGraalVM Reachability Metadataを利用できるようにしておく。このpluginでは、buildArgを使って最適化レベルなども設定できる(この例では最適化レベルを指定)。もちろん、native-image.propertiesに追加すれば、native-imageツール(Maven/Gradle pluginも同じ)が読み取ってくれる。
<plugin>
    <groupId>org.graalvm.buildtools</groupId>
    <artifactId>native-maven-plugin</artifactId>
    <configuration>
        <metadataRepository>
            <enabled>true</enabled>
        </metadataRepository>
        <buildArgs combine.children="append">
            <buildArg>-Ob</buildArg>
        </buildArgs>
        <quickBuild>true</quickBuild>
    </configuration>
</plugin>
アプリケーション構成
このアプリはデータベースに接続し、Azure Monitorに接続するので、
- 接続先のデータベース情報
- Azure Monitor関連の情報(Traces、Metrics)
が必要である。
1) データベース関連
datasourceの設定に記載しておく。
2) Azure Monitor関連
Application Insightsの接続文字列を設定しておく。依存関係の問題で、MetricとTraceで異なる箇所に設定しなければならないのがちょっとあれだが、できるだけ共通化できるよう、環境変数で渡すようにしておくのが吉。
micronaut:
  application:
    name: micronaut-telemetry-movie
  metrics:
    enabled: true
    binders:
      files:
        enabled: true
      jdbc:
        enabled: true
      jvm:
        enabled: true
      logback:
        enabled: true
      processor:
        enabled: true
      uptime:
        enabled: true
      web:
        enabled: true
    export:
      azuremonitor:
        enabled: true
        step: PT1M
        connectionString: ${AZURE_MONITOR_CONNECTION_STRING}

datasources:
  default:
    driver-class-name: org.postgresql.Driver
    db-type: postgres
    url: ${JDBC_URL}
    username: ${JDBC_USERNAME}
    password: ${JDBC_PASSWORD}
    dialect: POSTGRES
    schema-generate: CREATE_DROP
    hikari:
      connection-test-query: SELECT 1
      connection-init-sql: SELECT 1
      connection-timeout: 10000
      idle-timeout: 30000
      auto-commit: true
      leak-detection-threshold: 2000
      maximum-pool-size: 10
      max-lifetime: 60000
      transaction-isolation: TRANSACTION_READ_COMMITTED

azure:
  tracing:
    connection-string: ${AZURE_MONITOR_CONNECTION_STRING}

otel:
  exclusions: /health, /info, /metrics, /actuator/health, /actuator/info, /actuator/metrics
これでひとまずJavaアプリケーションとしてビルドしておく。
mvn clean package
Javaアプリケーションとしての動作確認
問題なくアプリケーションが動作し、Application Insightsにtraceが送信され、metricも出力されていることを確認する。このタイミングで、Tracing Agentを使ってアプリケーションを実行し、必要な構成ファイルを生成しておく。
# (1) reflect-config.jsonなどを取得
$JAVA_HOME/bin/java -agentlib:native-image-agent=config-output-dir=src/main/resources/META-INF/{groupId}/{artifactId}/ -jar ./target/{artifactId}-{version}.jar

# (2)-a trace fileを生成
$JAVA_HOME/bin/java -agentlib:native-image-agent=trace-output=/path/to/trace-file.json -jar ./target/{artifactId}-{version}.jar
# (2)-b 作成したtrace fileからartifact固有のreachability metadataを生成
native-image-configure generate --trace-input=/path/to/trace-file.json --output-dir=/path/to/config-dir/
Configure Native Image with the Tracing Agent
https://www.graalvm.org/latest/reference-manual/native-image/guides/configure-with-tracing-agent/
Collecting Metadata with the Tracing Agent
https://www.graalvm.org/latest/reference-manual/native-image/metadata/AutomaticMetadataCollection/
以下のファイルを所定のディレクトリに作成する。
| ファイル | jni-config.jsonreflect-config.jsonproxy-config.jsonresource-config.jsonreachability-metadata.json |
| 場所 | src/main/resources/META-INF/native-imagenative-imageツールは、上記ディレクトリ以下にある構成ファイルを拾い出すが、以下のようにgroupId、artifactIdでディレクトリを切ったサブディレクトリにファイルを配置してビルドすることが推奨されている。 src/main/resources/META-INF/native-image/{groupId}/{artifactId} |
native-image.properties
mvn package -Dpackaging=native-image
でNative Imageを作成するが、クラスの初期化タイミング(ビルド時、実行時)やnative-imageツール(Maven plugin)へのコマンドラインオプション、JVM引数をnative-image.propertiesに設定する。pom.xml内にも記載できるが、こうした設定は外部化しておくことを推奨。このあたりはmetricのエントリに記載しているので、詳細は省略する。
Native Imageのビルド
ビルドには時間を要するので、開発環境かつテストであれば、Quick Buildを有効にして、最適化レベルを-Obにすることを推奨する(それでも時間はかかる)。
Native Image Options
https://graalvm.github.io/native-build-tools/latest/maven-plugin.html#native-image-options
https://graalvm.github.io/native-build-tools/latest/gradle-plugin.html#native-image-options
Optimization Levels
https://www.graalvm.org/latest/reference-manual/native-image/optimizations-and-performance/#optimization-levels
Native Imageとしての動作確認
動作確認してみる。以下の呼び出しで、データ登録しておく。
$ curl -X PUT https://<Container AppsのURL>/api/movies
{"message":"Database initialized with default movies."}
これで3件のデータが登録されているので、実際に確認する。
$ curl https://<Container AppsのURL>/api/movies
[
  {
    "id": 1,
    "title": "Inception",
    "releaseYear": 2010,
    "directors": "Christopher Nolan",
    "actors": "Leonardo DiCaprio, Joseph Gordon-Levitt, Elliot Page"
  },
  {
    "id": 2,
    "title": "The Shawshank Redemption",
    "releaseYear": 1994,
    "directors": "Frank Darabont",
    "actors": "Tim Robbins, Morgan Freeman, Bob Gunton"
  },
  {
    "id": 3,
    "title": "The Godfather",
    "releaseYear": 1972,
    "directors": "Francis Ford Coppola",
    "actors": "Marlon Brando, Al Pacino, James Caan"
  }
]
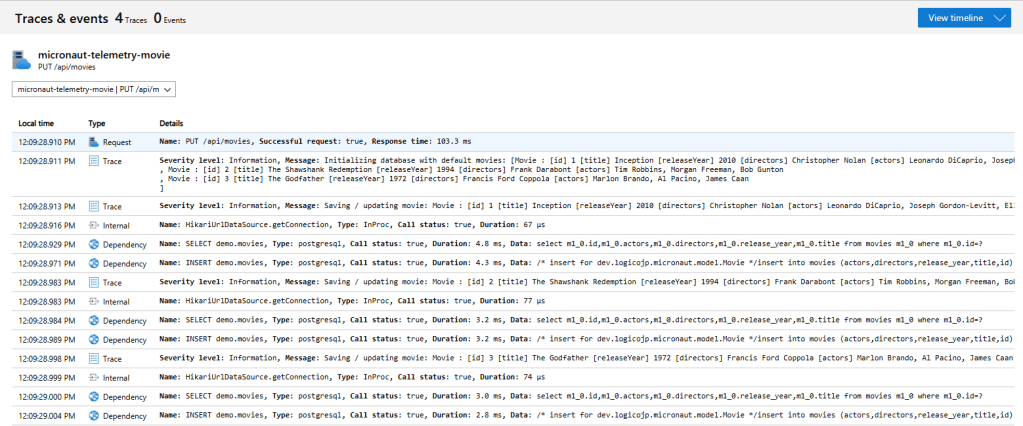
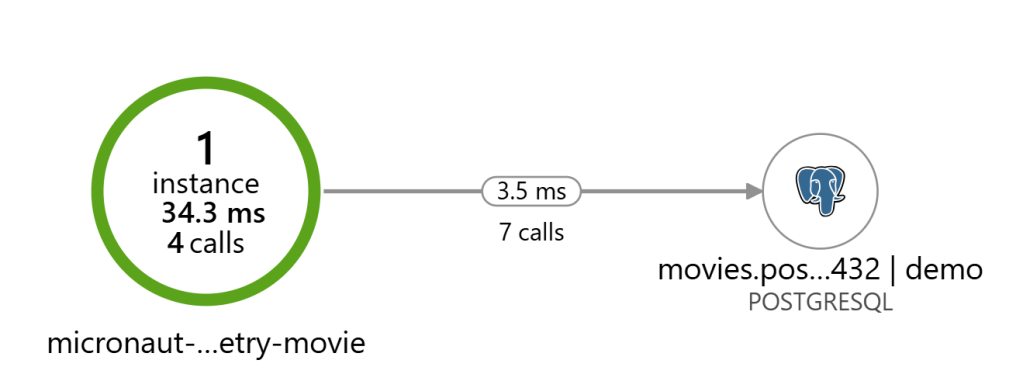
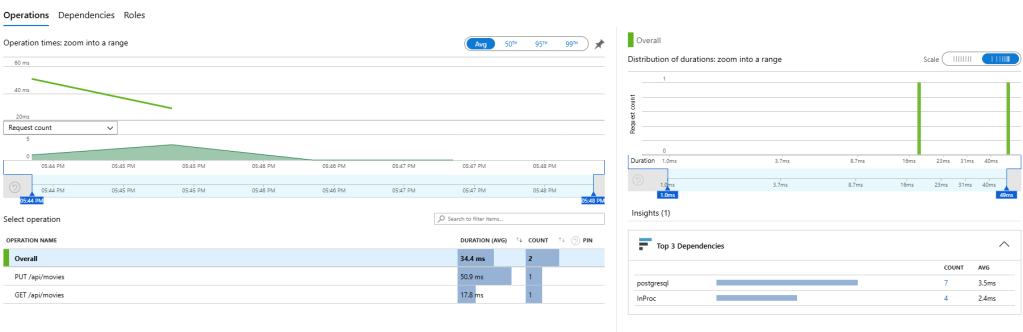
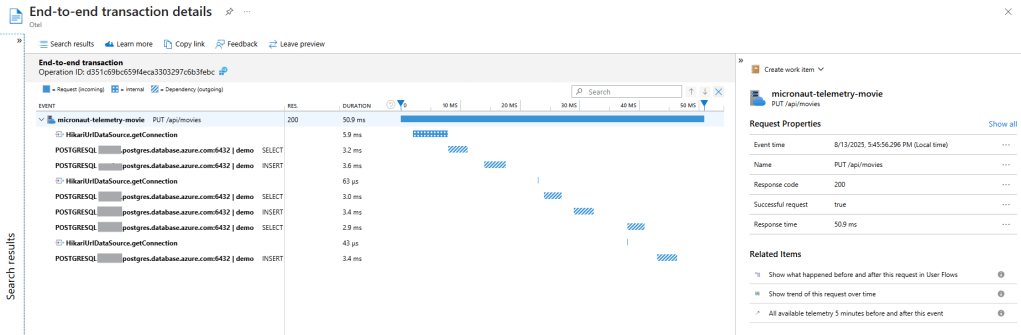
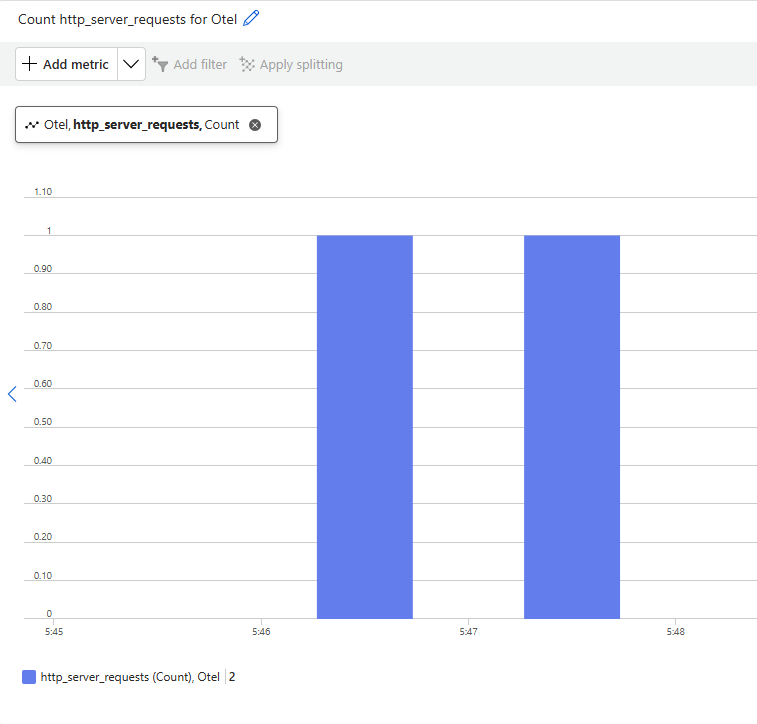
(1) Azure Monitor (Application Insights) から確認
trace、metricsは以下のよう。
(2) 取得できるmetricの確認
GET /metrics で確認すると以下のよう。
{
  "names": [
    "executor",
    "executor.active",
    "executor.completed",
    "executor.pool.core",
    "executor.pool.max",
    "executor.pool.size",
    "executor.queue.remaining",
    "executor.queued",
    "hikaricp.connections",
    "hikaricp.connections.acquire",
    "hikaricp.connections.active",
    "hikaricp.connections.creation",
    "hikaricp.connections.idle",
    "hikaricp.connections.max",
    "hikaricp.connections.min",
    "hikaricp.connections.pending",
    "hikaricp.connections.timeout",
    "hikaricp.connections.usage",
    "http.server.requests",
    "jvm.classes.loaded",
    "jvm.classes.unloaded",
    "jvm.memory.committed",
    "jvm.memory.max",
    "jvm.memory.used",
    "jvm.threads.daemon",
    "jvm.threads.live",
    "jvm.threads.peak",
    "jvm.threads.started",
    "jvm.threads.states",
    "logback.events",
    "process.cpu.time",
    "process.cpu.usage",
    "process.files.max",
    "process.files.open",
    "process.start.time",
    "process.uptime",
    "system.cpu.count",
    "system.cpu.usage",
    "system.load.average.1m"
  ]
}
とはいえ、Native ImageなのでJVM関連の正しい情報は取得できない。例えばGET /metrics/jvm.memory.max を呼び出すと以下の通り。-2ってなんやねん。。
{
  "name": "jvm.memory.max",
  "measurements": [
    {
      "statistic": "VALUE",
      "value": -2.0
    }
  ],
  "availableTags": [
    {
      "tag": "area",
      "values": [
        "nonheap"
      ]
    },
    {
      "tag": "id",
      "values": [
        "runtime code cache (native metadata)",
        "runtime code cache (code and data)"
      ]
    }
  ],
  "description": "The maximum amount of memory in bytes that can be used for memory management",
  "baseUnit": "bytes"
}
CPU Usageを取得するために GET /metrics/process.cpu.usage を実行すると、以下の通り。
{
  "name": "process.cpu.usage",
  "measurements": [
    {
      "statistic": "VALUE",
      "value": 0.0017692156477295067
    }
  ],
  "description": "The \"recent cpu usage\" for the Java Virtual Machine process"
}
Traceにログを入れたい場合
以下のエントリに記載した内容をZero-code instrumentationで実現したいところだが、Application InsightsのTracesテーブルへの書き込みのために必要なOpenTelemetryオブジェクトは、Azure-Tracingの依存関係から導出できない。
そのため、明示的に宣言する必要がある。以下の例は、MovieControllerのコンストラクタで明示的に宣言して、Appenderを構成している。Appenderの構成は以前のエントリに記載した通りなので省略する。
@Inject
AzureTracingConfigurationProperties azureTracingConfigurationProperties;

private static final Logger logger = LoggerFactory.getLogger(MovieController.class);

public MovieController(AzureTracingConfigurationProperties azureTracingConfigurationProperties) {
    this.azureTracingConfigurationProperties = azureTracingConfigurationProperties;
    AutoConfiguredOpenTelemetrySdkBuilder sdkBuilder = AutoConfiguredOpenTelemetrySdk.builder();
    AzureMonitorAutoConfigure.customize(sdkBuilder, azureTracingConfigurationProperties.getConnectionString());
    OpenTelemetryAppender.install(sdkBuilder.build().getOpenTelemetrySdk());
    logger.info("OpenTelemetry configured for MovieController.");
}
明示的に宣言が必要なのでZero-code instrumentationではないが、この設定さえあれば、Traceにログが残る。